Transportation resilience in an electrifying world
Ryan Cornell, Instructor, Senior Global Futures Scientist ASU School of Sustainability
Part 1: Current Transportation System
What would you do if gasoline prices jumped to $10 a gallon? Could you get to work if your car stopped working?
Price spikes and mechanical problems are minor annoyances to some, and life-altering emergencies to others. It is easy to believe in the inevitability of dependable transportation, yet this is not a certainty.
How resilient is our current transportation system? Are some geographic areas more resilient than others?
Part 2: Current Inequities and How They Impact the Future
What does our future transportation system look like? Will it be resilient?
What does our society look like when 50% of the cars on the road are electric? Do we see an even distribution of electric vehicles, charging stations, and vacated gas stations across all zip codes? Or, will we enter a bifurcated transportation future: one America full of resilient communities filled with electric vehicles (EVs) and well-developed charging infrastructure, and another America full of ageing gasoline-powered cars, nascent charging infrastructure, and dilapidated gas stations.
The distribution is unlikely to be equal, as we are already witnessing extreme geographic inequity among electric vehicle adoption.
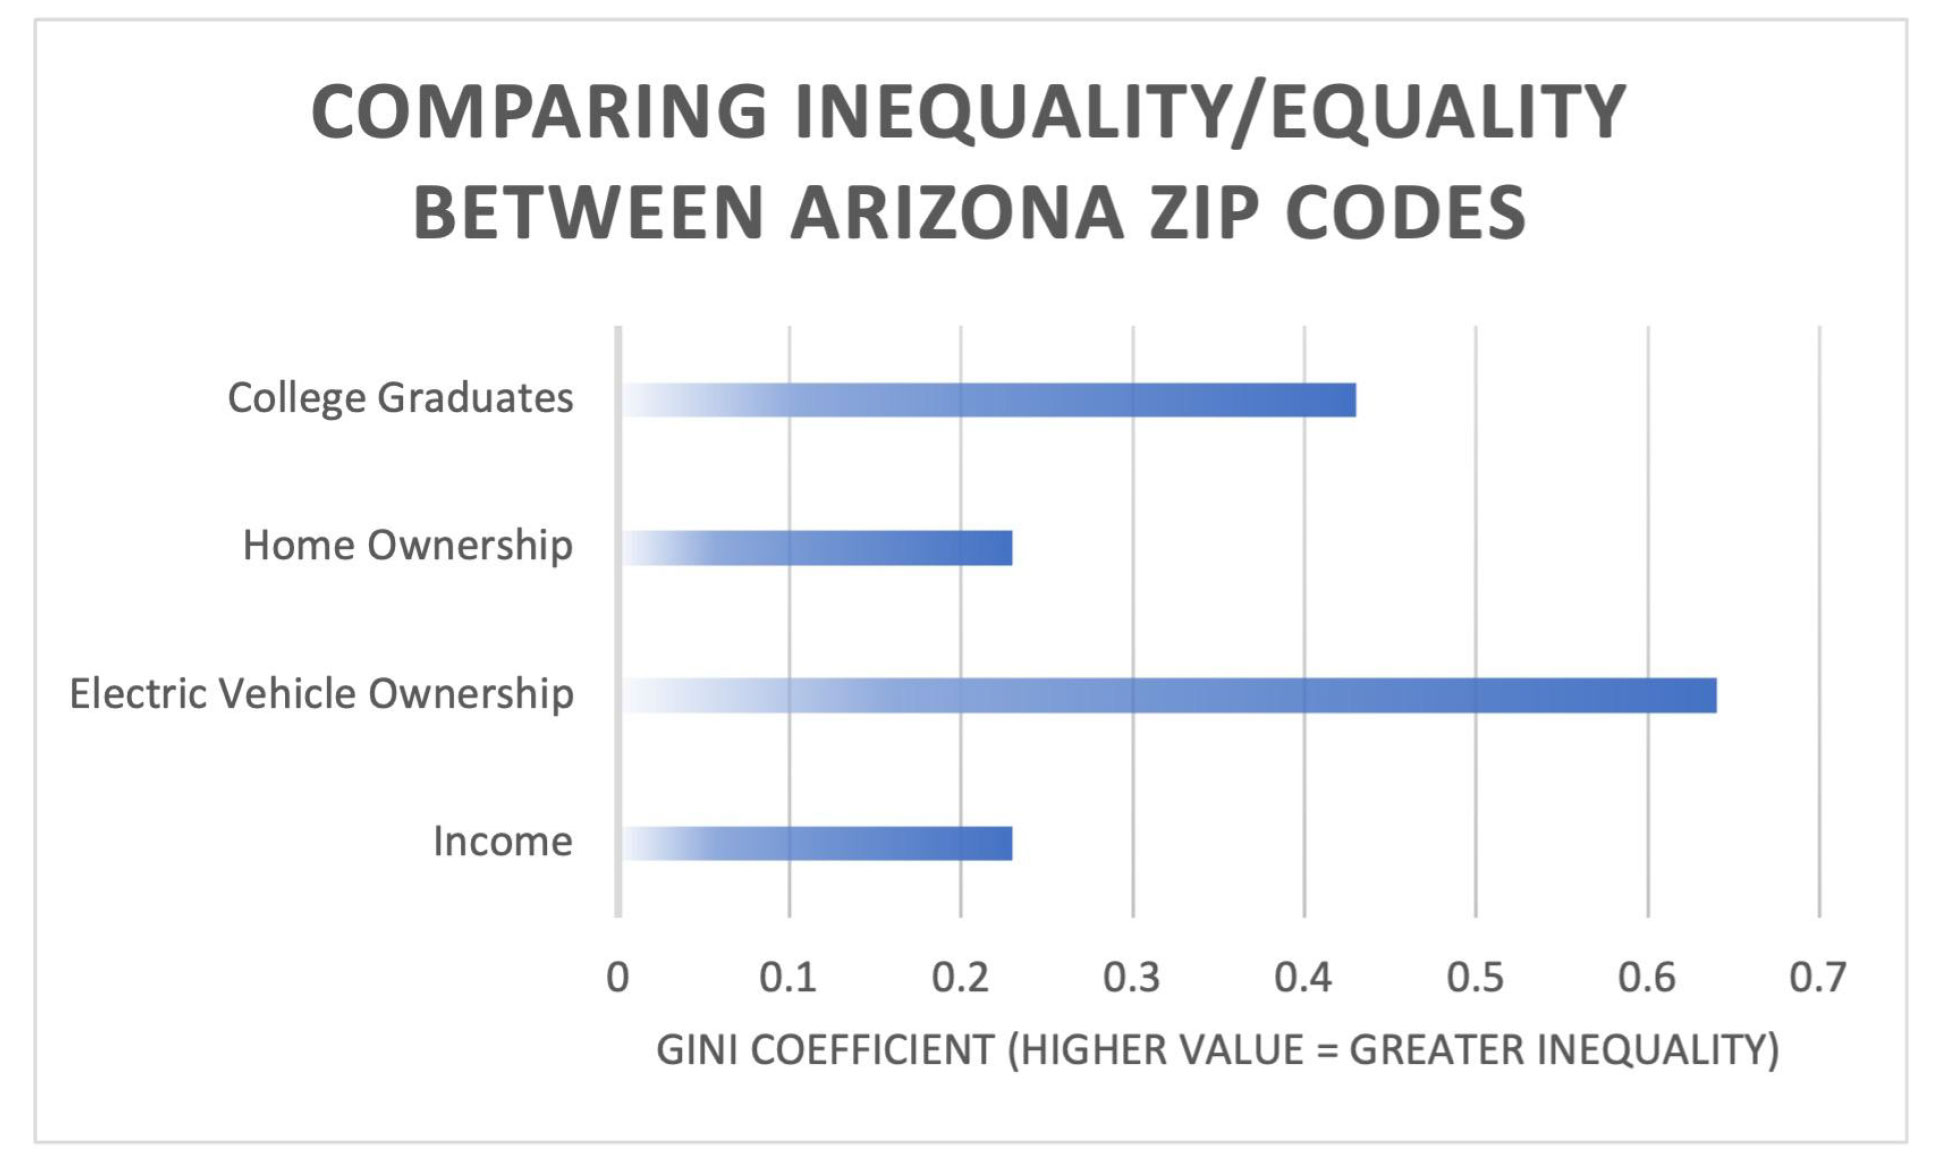
We can assess this inequality by using something called the “Gini coefficient.”
A score of 0 represents a system that is perfectly equal, while a score of 1 indicates a system that is perfectly unequal. Thus, a lower score represents more equality and a higher score represents more inequality.
I analysed zip code data to determine the Gini coefficient for a variety of variables and the results were startling.
As you can see from the graph to the right, the adoption of electric vehicles is more unequally distributed among zip codes than income, home ownership, or college degrees.

The Gini coefficient is an interesting index, but what does this visually look like?
The following map shows exactly that (electric vehicle adoption rates among Arizona zip codes):
Part 3: Solutions
Why is this happening?
What is standing in the way of a more uniform adoption of electric vehicles?
Unfortunately, the question of “why” this is happening may actually be irrelevant. The adoption of electric vehicles is going to happen, whether it takes 5, 10, or 50 years. It is happening.
Thus, we may need to stop asking why the adoption is so unequal and start asking: “What can we do to make sure that EVERYONE has the CAPABILITY to move to an electric vehicle?”
Current electric vehicle inequities may lead to severe long-term consequences: What happens when someone needs to buy an electric vehicle, but the charging infrastructure doesn’t exist in their zip code?
Public charging infrastructure is obviously important, but more importantly we need to make sure individuals can charge at home (or work). The beauty of an electric vehicle is that it can charge anywhere.
Homeowners may be surprised to find out that their home likely already has the capability to charge an electric vehicle.
This “capability” is the standard power outlet sitting in their garage. Furthermore, installing outlets in apartment complex parking lots would give tenants the same capability.
The following calculator allows users to determine how likely it is that a standard outlet (Level 1 charging) would be enough:
Ryan Cornell
Instructor, Senior Global Futures Scientist
ASU School of Sustainability
Academic Fellow, 2023
Ryan Cornell is an Instructor and Senior Global Futures Scientist at Arizona State University’s School of Sustainability. His past research, speaking, and writing has focused on sustainable transportation, quantifying automotive externalities, and electrifying the transportation sector.
