
Can visualizing the gap between household incomes and true costs of living motivate policy change?
Steve Torres, Valley of the Sun United Way
Background
Due to the rising costs of living in cities across Arizona, family and individual households are experiencing gaps in covering some basic needs. There are government programs to help provide access to basic needs for families and individuals. However those benefits are allocated based on government measures such as the federal poverty line (FPL), which fails to capture certain factors into the cost of living like healthcare, housing, transportation, child care, internet access, and many other factors. Torres argues that we need to consider a holistic view of the real cost of living in communities across Arizona and identify the populations and communities experiencing these gaps in order to provide and deliver necessary services and resources.
Research questions
-
What populations are experiencing gaps in their basic needs due to the high cost of living?
-
How can insights from the dashboard influence or support community and government policy change?
Methods and findings
Torres reviewed datasets from the Census Bureau, the Arizona Department of Health, the Council for Community & Economic Research, and more to create a comprehensive index of living costs. He then used the compiled data sources to design a dashboard to help visualize the data. Visualizations were created to help the user understand gaps in services for vulnerable populations. He and his partners designed the dashboard to be interactive and allow the user to explore other data points such as demographics. Finally, Torres held a focus group in order to gather user feedback on the dashboard and data. Members were recruited from the community, academia, funders and service providers, introduced to the dashboard and allowed to explore it. Feedback was then captured on their experience through surveys. Working on this project, Torres learned to step outside of creating data visualizations for targeted audiences. This dashboard had to be user-friendly to a wide variety of audiences. Therefore he spent time researching dashboard design intended for a wide variety of audiences.
Partners
-
Valley of the Sun United Way
-
Sarbeswar Praharaj, ASU Knowledge Exchange for Resilience
Impact
Poverty is a dynamic condition that a population can experience for many different reasons. Some vulnerable populations are being affected by the rising cost of living and aren’t able to access or qualify for certain public benefits. This can lead to families and individuals not being able to meet certain basic needs. Families and individuals experiencing these issues don’t have the income to meet their basic needs. However they may not be considered to be living in poverty or qualify for public benefits.
Torres hopes that his dashboard will help to identify the unmet needs and communities of these vulnerable populations. Furthermore, he hopes it can help guide outreach strategies, services and resources. Leveraging insight gained from the dashboard can assist community, government, and other organizations in decision-making around the issues affecting these vulnerable populations. This can help promote the need to increase or continue support for basic need services and resources for families and individuals.
Deliverables
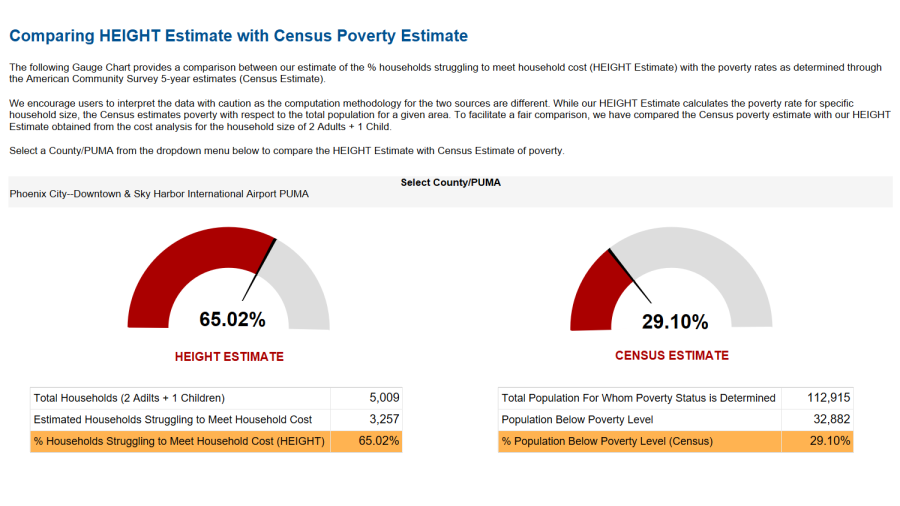
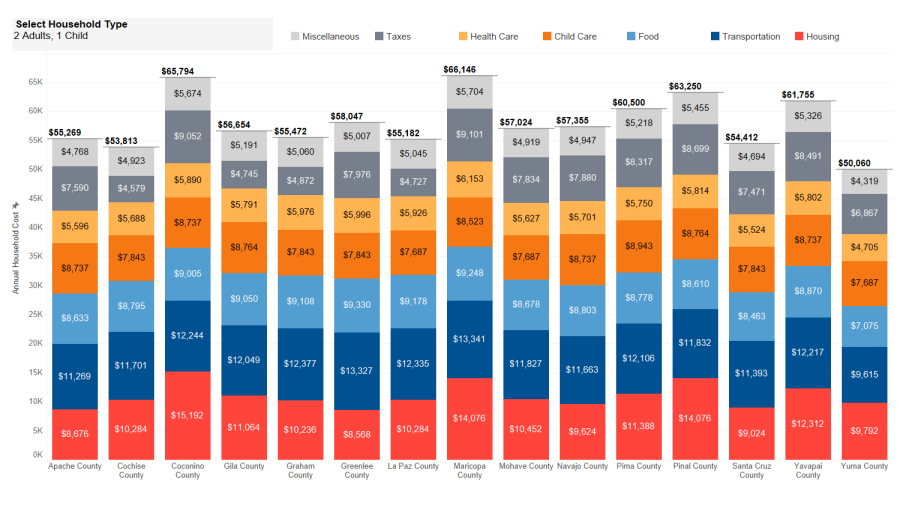
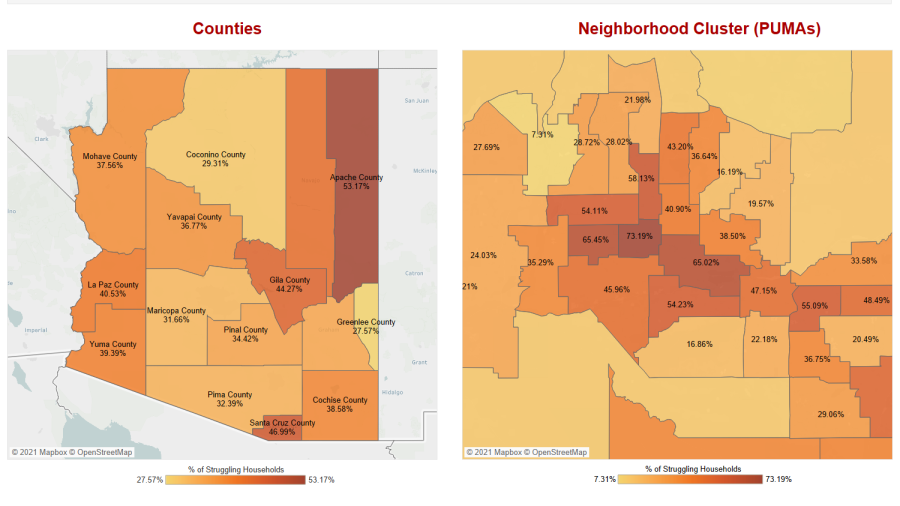
Explore Torres's interactive HEIGHT poverty dashboard to learn more about the gap between incomes and household expenses in Arizona.
Steve Torres

Valley of the Sun United Way
Community Fellow, 2021
Phoenix native. I have over 5 years experience in systems and data analysis work. I specialize in data visualizations.