Maricopa County: Eviction Dashboard
Overview
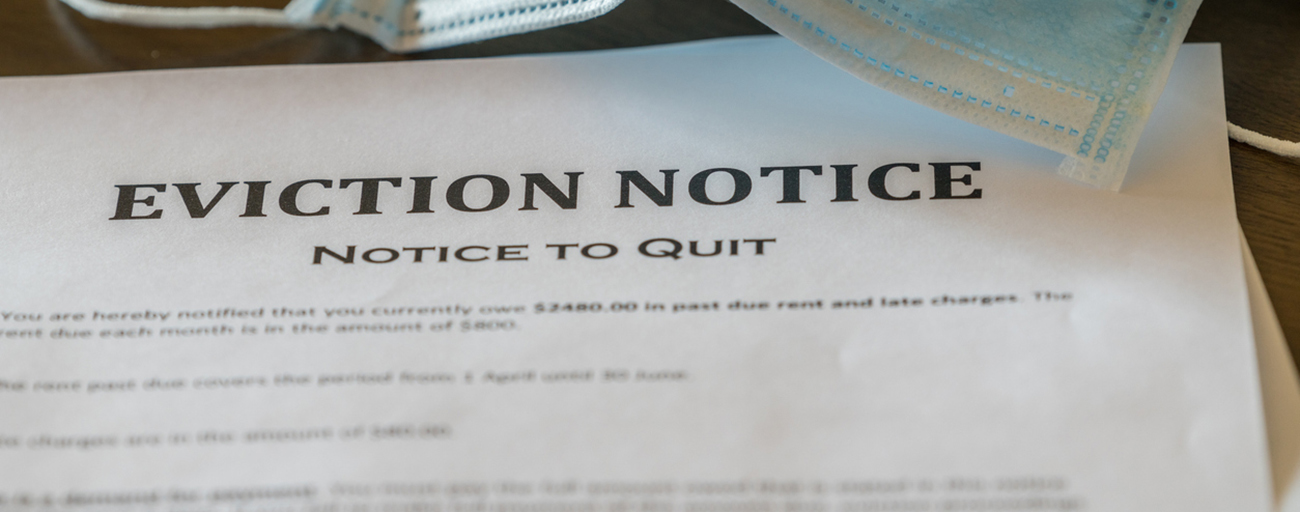
Arizona has one of the highest housing loss rates in the country, and Maricopa County leads the nation in evictions, boasting a rate of nearly twice the national average. Prior research has also shown that certain demographic groups, such as low-income women and women of color, are disproportionally affected by evictions. In addition to the normal stress of rising housing and rent costs, the COVID-19 pandemic is expected to exacerbate the rate of housing loss once the eviction moratorium ends. An eviction occurs when a landlord expels a tenant from property that he or she owns, typically in response to unpaid or late rent payments. The tenant’s inability to pay the rent is not a legal defense to the lawsuit.
The visualizations provided in this dashboard utilize data obtained from the Maricopa County Justice Courts. Represented are every eviction filing, regardless of outcome (decided in favor of the plaintiff, decided in favor of the defendant, or unknown/adjudicated outside of the courtroom). Of note, prior research shows that less than one percent of eviction filings with known outcomes are decided in favor of the defendant (tenant). The eviction rate for the county is calculated using the formula: number of eviction filings/number of renter-occupied housing units. Data on the number of renter-occupied housing units come from the American Communities Survey five-year estimates.
The visualizations in this second series of maps allow for the exploration of various census demographics as they relate to the eviction rate in Maricopa County. Demographic data includes income, poverty, employment status, health insurance, family structure, and race.
Suggested Citation
Lamar, Shea, Lora Phillips, and Patricia Solís. (2021). "Visualization: Maricopa County Evictions Dashboard." Resilience Data Dashboard Series, Knowledge Exchange for Resilience, Maricopa County Justice Courts, 2016-2020. Available from Arizona State University, https://resilience.asu.edu/evictions-dashboard.