
Visualization: Temperatures in Maricopa County
Overview
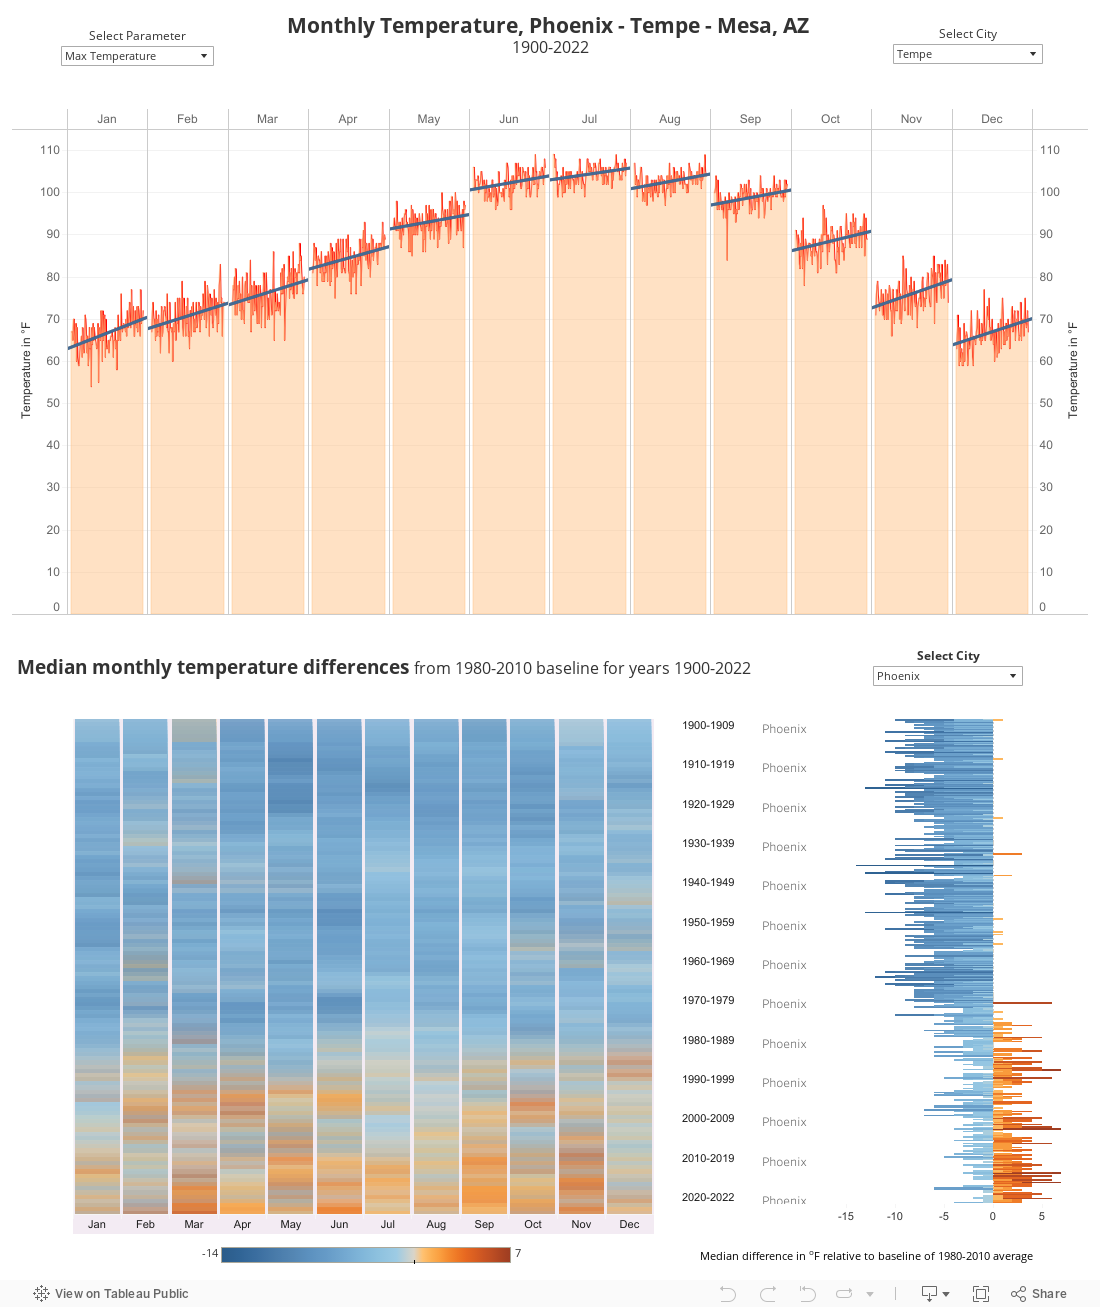
How have temperatures changed across major Maricopa County cities? The following heatmap and bar graph analyzes the median monthly temperatures since the early 1890s. It shows the break-even point in the temperature rise phenomenon and how weather compares to the baseline.
Data source: Arizona State Climate Office
Suggested Citation
Praharaj, Sarbeswar, Elizabeth A. Wentz, Yash Vakil, Patricia Solís, Amal Shifwath Shaik, and Brajesh Karna. (2023). "Visualization: Temperatures in Maricopa County." Resilience Data Dashboard Series, Knowledge Exchange for Resilience and Arizona State Climate Office, 1900-2018. Available from Arizona State University, https://resilience.asu.edu/temperature.