Data for Solutions
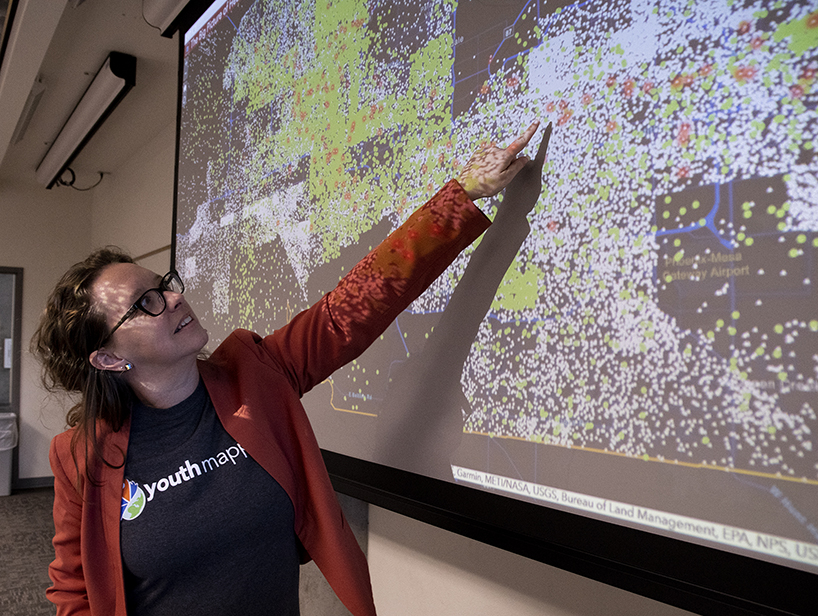
We bring together data from federal and state agencies with data from local organizations. This generates meaningful insights with the power to catalyze innovative responses. By breaking down data silos, we can identify hidden vulnerabilities, help decision makers more effectively allocate resources, and inform efforts to transform our systems.

Dashboards
and Tools
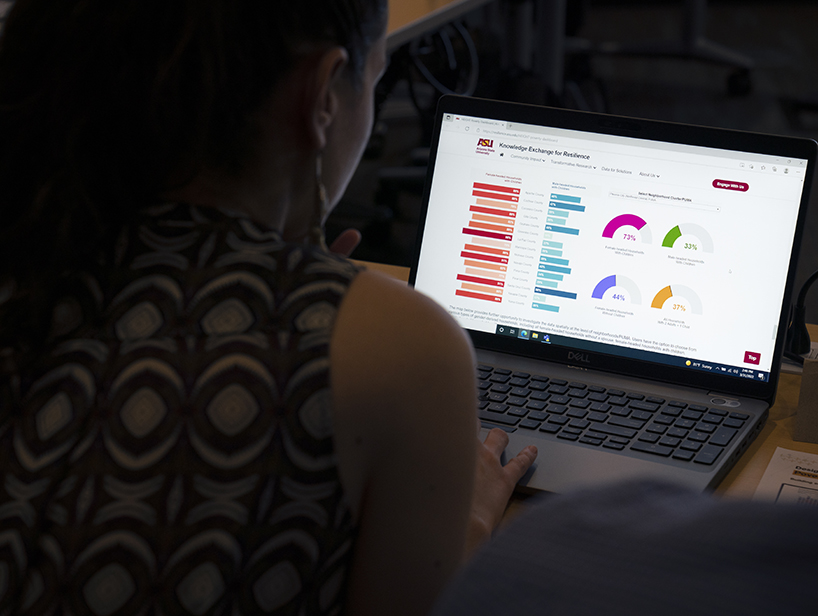
We create user-friendly dashboards, apps and visualizations to make resilience metrics and data analyses more accessible.
Explore Data Tools
Data Exchange
When we share and exchange data, we can ask better questions and find more accurate answers. Find out how to access our data or share data with us.
Learn More
30% of indoor heat-related deaths in Maricopa County occur in mobile homes.

People who live in mobile homes are 6–8 times more likely to die of heat-associated deaths.

In Maricopa County, ⅓ of households are renters, but evictions accounted for 96% of housing loss from 2017–2019.

Insights
and discoveries
Our collaborative approach to data has generated new insights into the threats and shocks we’re facing and how we can best bolster resilience to them.
Learn More

